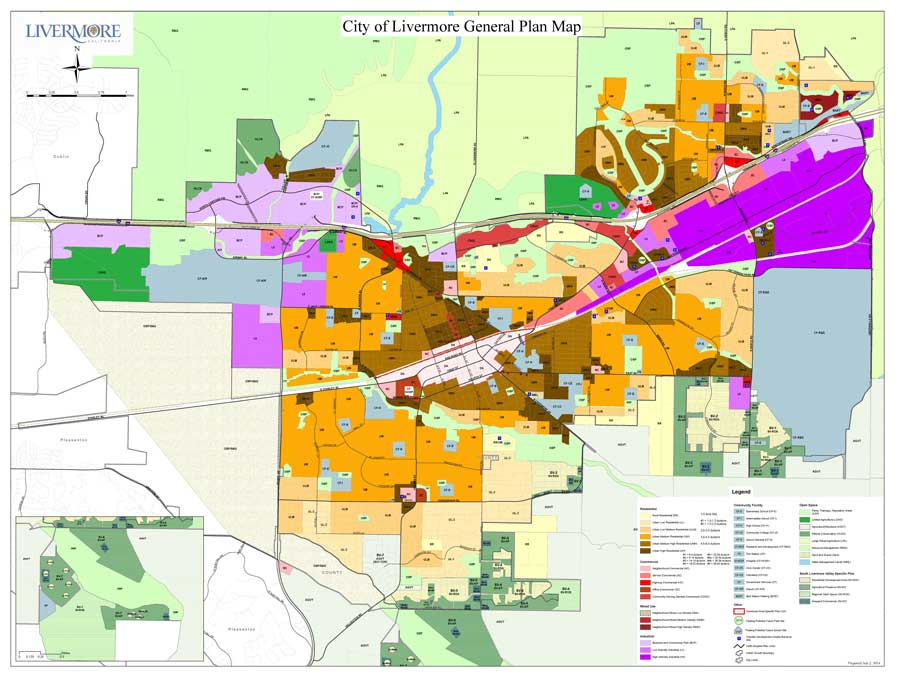
Start your urban planning journey with these quick tips: Analyze land use patterns by overlaying zoning maps, assess sustainability through green space ratios, and simulate growth scenarios using GIS tools.
Step-by-step usage: 1) Load base maps; 2) Apply land use filters; 3) Visualize changes over time; 4) Export reports. For full documentation, visit urban planning resources online.
Watch this introductory video for a crash course on urban planning basics:
Explore charts, filters, and statistical tools to uncover urban trends. Filter by population density, traffic patterns, or environmental impact to inform land use decisions.
Urban planning data make sense when visualized in not just maps but charts and graphs too. Data visualization enhances understanding of complex urban patterns and trends, such as predicting sprawl or optimizing resource allocation for sustainable development.
Learn more about big data's role in smart cities:
Access downloadable map products focused on land use, including zoning, residential vs. commercial areas, and green belts. Use these for urban expansion planning and policy-making.
Downloadable map products in JPEG format for reports and presentations. High-resolution maps suitable for printing and digital use, highlighting land use categories like agricultural, industrial, and recreational zones to support balanced urban growth.
Explore this video on land use basics in city planning:
Utilize remote sensing tools for real-time urban monitoring, detecting land use changes like deforestation or sprawl. Select from multispectral or hyperspectral imagery for detailed analysis.
Access to remote sensing imagery and analysis tools for urban monitoring. Options for different satellite data sources and temporal resolutions, aiding in land use classification, environmental impact assessment, and disaster response planning.
Discover why remote sensing is essential for urban planning: