Nairobi GIS Hub is an interactive planning and property-intelligence
platform covering Nairobi City County. It combines map navigation,
parcel search, planning layers, document panels, analytics, and
aviation planning insights in one workspace.
Key Capabilities: parcel / LR lookup with
autocomplete, coordinate-based parcel query, geocoding with live
suggestions, seven basemaps, layer opacity control, layer attribute
filtering, right-click coordinate tools, distance & area
measurement, route analysis, nearest-facility search, swipe layer
comparison, isochrone travel-time analysis, GeoJSON upload &
validation, draggable attribute table with search/sort/pagination,
print modes, map-state sharing and restore, WhatsApp support, and
in-app issue reporting.
Access: The application uses a login gate —
unauthenticated visitors are redirected to the login page.
Default View: The map opens on White Paper inside
Nairobi's county bounds with a coordinate grid overlay enabled.
System Requirements: Modern web browser with
JavaScript enabled. Optimised for desktop and mobile devices.
Quick Start
Sign in — Login is required before the map
interface loads.
Navigate — Pan/zoom, then switch basemaps from
the layer control (White Paper is active by default).
Find a parcel — Type a parcel number or LR number
in the top search bar. The app highlights the parcel in yellow,
flies to it, and displays property details in a popup.
Query by coordinate — Enter latitude/longitude in
the query panel to locate the containing parcel and drop a marker
at its centroid.
Toggle layers — Open the layer control
(top-right) to switch basemaps and toggle administrative,
planning, cadastre, and water overlays. Use the opacity slider to
fine-tune visibility.
Inspect attributes — Open the Attribute Table,
choose a layer, search/filter records, then click a row to fly to
that feature on the map.
Filter features — Use the Filter Builder to query
a layer by attribute (field, operator, value) and highlight
matching features.
Top menu panels — Click Guide,
Data, Maps, Imagery, or
Aviation in the top bar. Press Escape to
close any open panel.
Map Controls (Top-Left Toolbar)
Navigation
Control
Function
Shortcut
Home
Reset to Nairobi County overview (-1.296, 36.884, zoom 11.5)
—
Refresh
Fly to Nairobi CBD (-1.286, 36.817, zoom 18)
—
Reload
Full page reload — re-fetches all data
F5
Fullscreen
Toggle fullscreen map view
F11
Locate Me
Fly to your current position via browser geolocation
—
Search & Data
Control
Function
Shortcut
Geocoding
Place search with live suggestions, keyboard navigation, and
fly-to marker
—
Filter Builder
Query a layer by attribute — set field, operator, value and
highlight matches
—
Attribute Table
Draggable, dockable table — search, sort, paginate, and click
rows to zoom
—
Analysis
Control
Function
Shortcut
Measure
Open sub-menu for distance line or area polygon measurement
Esc to cancel
Route & Access
Pick driving or walking, click start + destination — shows
route, distance and travel time
—
Nearest Facility
Find facilities within 2.5 km (Water, DC Policy, Zoning,
Parcels)
—
Layer Comparison
Side-by-side overlay comparison — pick left/right layers and
drag the divider
—
Isochrone
Click the map to generate 5 / 10 / 15-minute driving or
walking reachability zones
—
Output & Sharing
Control
Function
Shortcut
Share
Copy a shareable link that preserves view, layers, search
state, and drawings
Load a WGS 84 GeoJSON/JSON file and zoom to features
—
Clear Upload
Remove uploaded GeoJSON features from the map
—
Other On-Screen Controls
Interface Controls
Control
Function
Position
🗂
Layer Control
Switch basemaps and toggle overlay layers
Top-right
🔍
Opacity Slider
Adjust opacity (0–100 %) for any basemap or overlay
Top-right
📐
Grid Overlay
Semi-transparent coordinate grid drawn over tiles
Full map
📏
Scale Bar
Distance reference that updates with zoom
Bottom-left
⬆
North Arrow
Orientation indicator
Bottom-right
🗺
Mini Map
Collapsible overview inset showing current extent
Bottom-right
📜
Legend
Collapsible legend with sections for population, roads,
rivers, reservoirs, and land use
Top-left
Support
Control
Function
Shortcut
🚨
Report an Issue
Open a form to submit map, data, or UI problems
—
💬
WhatsApp
Direct support chat via WhatsApp
—
Map Navigation & Data Layers
Basic Navigation
Pan: Click and drag to move the map
Zoom: Scroll wheel or +/− buttons
Keyboard: Arrow keys for precise panning
Double-click: Zoom in at cursor location
Right-click: Context menu with coordinate copy
and Google Maps link options
Base Maps (7)
CartoDB Dark Matter — Dark theme with labels
CartoDB Positron — Light theme, no labels
Google Hybrid — Satellite imagery with roads
OpenStreetMap — Standard community street map
Google Terrain — Terrain & hillshade
ESRI Topo — Topographic reference map
White Paper (default) — Blank white canvas
for overlay analysis
Overlay Layers
Nairobi City Sub-County — Administrative
boundaries with dashed lines and labels
Nairobi Ward Boundary — Electoral ward
polygons with interactive labels/tooltips
Converted Survey Blocks — Cadastral survey
boundaries with zoom-dependent labels
Major Roads — Road network classified as
A/B/C/S with zoom-dependent labels
Landuse Zoning 2023 — Interactive land-use
polygons with hover highlight and popup
Parcels Cadastre — Parcel outlines visible at
zoom 14+; lazy-loaded on first toggle
Population Density — Choropleth (persons/km²)
with info panel and legend
DC Policy 2026 — Development control zones
with hover detail panel (compact/detailed toggle)
Water Distribution Zones — Service zones with
click-to-open popup and auto-centre
Water Reservoirs — Reservoir / springs / tank
markers with popup details
Rivers & Waterbodies — Hydrographic
features with zoom-dependent labels
Kenya Counties — National county outlines
with dashed lines and labels
Tip: Some layers and labels show/hide automatically based
on zoom level. Zoom in to reveal labels for roads, rivers, survey
blocks and parcels.
Search & Analysis Tools
Property Search
Parcel Lookup: Type a parcel number or LR number in
the top search bar. Auto-complete suggestions appear as you type.
Selecting a result highlights the parcel in yellow, flies to its
location, and shows a detailed popup with zoning, DC policy, and
change-of-user guidance.
Geocoding: Use the geocoding panel to search for
places, addresses, or landmarks. Supports live Nominatim
suggestions, Arrow Up/Down navigation, Enter-to-select, and a
location popup with coordinates.
Coordinate Query: Enter latitude/longitude in the
query panel to find the parcel containing that point, or right-click
anywhere on the map to copy coordinates or open Google Maps.
Measurement Tools
Distance: Click points to build a measurement
line — live distance shown in metres in a closable popup
Area: Click vertices to draw an area polygon —
result shows hectares, km², m², and acres
Reset: Clear measurements via the tool action,
popup close, or Escape key
Route & Proximity Tools
Route & Access: Select driving or walking,
click a start and end point — the route line, distance, and
estimated travel time are shown with animated direction arrows
Nearest Facility Finder: Pick a category (All
Facilities, Water Resources, DC Policy 2026, Zoning Areas, Land
Parcels), then click the map or use the latest geocoded location
to list the nearest options within 2.5 km
Layer Comparison (Swipe Tool)
The Swipe tool lets you compare two overlay layers side by side on
the same map. Open it from the toolbar, select a
Left Layer and a Right Layer from
the drop-downs, then drag the vertical divider to reveal one side or
the other. Floating badges label each side. Click
Reset to clear the comparison and restore normal
map display.
Isochrone / Travel-Time Areas
The Isochrone tool generates reachability zones around a point you
choose on the map. Select Driving or
Walking mode, then click a location. The tool
calculates 5-minute (green), 10-minute (amber), and 15-minute (red)
travel-time polygons using OSRM routing. Click
Clear to remove the zones.
Filter Builder
Open the Filter Builder from the toolbar, choose a layer, set field
+ operator + value, then apply. Matching features are highlighted
with an orange stroke and cyan fill on the map, and hover effects on
other layers are suppressed while a filter is active. Clicking
Reset removes the filtered layer from the map,
restores all styles, and re-enables hover interactions.
Data Analytics
Open the Data top-menu panel for interactive
dashboards: population density analytics, healthcare facility
distribution, and water-supply analytics from the Equitable Water
Distribution Programme.
Attribute Table
The Attribute Table opens as a floating, draggable panel and gives
spreadsheet-style access to layer records without leaving the map.
Layer Switching: Choose from Wards, Sub-Counties,
Survey Blocks, Roads, Rivers, Waterbodies, Zoning, DC Policy 2026,
Water Distribution Zones, Water Reservoirs, or Parcels.
Parcel Preload: Switching to Parcels triggers
proactive loading so search works even before parcels are visible
on the map.
Search & Filter: Type in the search box to
filter by any property value.
Clear: Removes the search filter, clears
selection, and removes any highlight polygon or marker.
Sort & Pagination: Click column headers to
sort; page through large datasets with Previous/Next.
Viewport Filter: Restrict results to features
currently visible in the map extent.
Row → Map: Click a row to fly to and highlight
the feature on the map.
Panel Tools: Drag, resize, dock to lower-left,
refresh, or close.
Drawing, Upload & Advanced Tools
Drawing & Export
Supported geometries: Point, MultiPoint,
LineString, MultiLineString, Polygon, MultiPolygon.
Select a geometry mode, click the map to draw
Press Finish to commit,
Escape to cancel
Point geometries are draggable after creation
Delete removes all drawn features
Download exports as GeoJSON (also copies to
clipboard)
GeoJSON Upload
Upload a WGS 84 (EPSG:4326) GeoJSON or JSON file. The app validates
the coordinate reference system, adds features to the map, and zooms
to the uploaded extent. Use the Clear Upload button
to remove them.
Map Printing
The print control offers Auto, Landscape, Portrait, and Custom (A4)
modes. Map controls and the sidebar are temporarily hidden during
print.
Shareable URLs
The Share button copies a URL that encodes the
current map centre, zoom, visible basemap, active overlays, searched
parcel, geocoded point, and any drawn features. Recipients see the
same view when they open the link.
Right-Click Context Menu
Right-click anywhere on the map to see WGS 84 coordinates with
options to copy lat/lng, copy a Google Maps link, or copy both.
Information Hub (Left Sidebar)
The sidebar organises reference content by topic. Click a menu item
to expand its section:
About — Platform overview and mission
Terms of Use — Legal agreements and policies
Acts & Policies — Key legislation and
planning documents
Land Use — Zoning regulations and classification
Survey Blocks — Cadastral mapping and survey data
Development Control — Building permits,
approvals, and approving authorities
Planning History — Historical development
policies
PLUPA 2019 — Physical and Land Use Planning Act
details
FAQs — Frequently asked questions
Fact Sheet — Key statistics about Nairobi
Weather & Climate — Meteorological data and
patterns
Population & Demographics — Census data and
trend charts
Open Spaces & Parks — Green spaces, parks,
and ecosystem services
Soils and Geology — Terrain characteristics and
geotechnical data
Urban Design — City planning principles and
projects
Water & Sewer — Water distribution and sewer
infrastructure
Relief & Hydrology — Topography and water
systems
Planning Handbook 2025 — National planning
standards reference
Contact — Email form and support
Top Menu Panels
Five buttons sit at the top centre of the map. Each opens a slide-in
panel:
Guide — This user manual
Data — Interactive analytics and visualisations
(population, health, water)
Maps — High-resolution map products with slider
navigation and downloads
Imagery — Remote sensing explainer, applications,
tools, and embedded media
Aviation — Airport/airbase planning overview,
land-use implications, and safeguarding priorities
Shortcuts, Mobile & Troubleshooting
Keyboard Shortcuts
Escape — Cancel drawing, close open
panels/sidebar
Arrow Keys — Pan the map
F11 — Toggle browser fullscreen
F5 — Hard refresh (reload all data)
Enter — Run geocode search or select highlighted
suggestion
Mobile & Touch
Responsive layout for all screen sizes
Pinch-to-zoom and touch-friendly buttons
Optimised popups and tooltips
Sidebar adapts to narrow screens
Attribute Table panel is draggable and resizable on touch
Troubleshooting
Slow loading: Check your connection, then try the
Reload button
Layers not showing: Some layers require a minimum
zoom level — zoom in and check the layer-control checkbox
Search returns nothing: Wait for data to finish
loading (check the loading spinner or browser console)
Mobile issues: Ensure JavaScript is enabled; try
refreshing the page
GIS Terminology
GIS (Geographic Information System): Tools for
analysing, storing, and visualising geographic data.
Overlay Layer: Additional data drawn on top of
the base map.
Choropleth Map: Thematic map using colour
gradients to show statistics by area.
Geocoding: Converting addresses or place names
into geographic coordinates.
GeoJSON: Open standard (RFC 7946) for encoding
geographic features in JSON.
Popup / Tooltip: Information window shown on
click (popup) or hover (tooltip).
Zoning: Legal regulations governing permitted
land use in specific areas.
Vector Data: Features represented as points,
lines, and polygons.
Raster Data: Grid of pixels (e.g. satellite
imagery).
Legend: Key explaining map symbols, colours, and
classifications.
Scale: Ratio between map distance and real-world
distance.
Projection: Method of representing Earth's curved
surface on a flat map.
Plot Ratio: Total floor area divided by plot area
— controls building bulk.
Ground Coverage: Building footprint divided by
plot area — controls open space.
Nairobi Data Analytics Hub
Explore comprehensive datasets through interactive visualizations. The
panel includes population density analytics, healthcare facility
distribution, and advanced water distribution analytics from the
Equitable Water Distribution Programme (June 2025).
📊
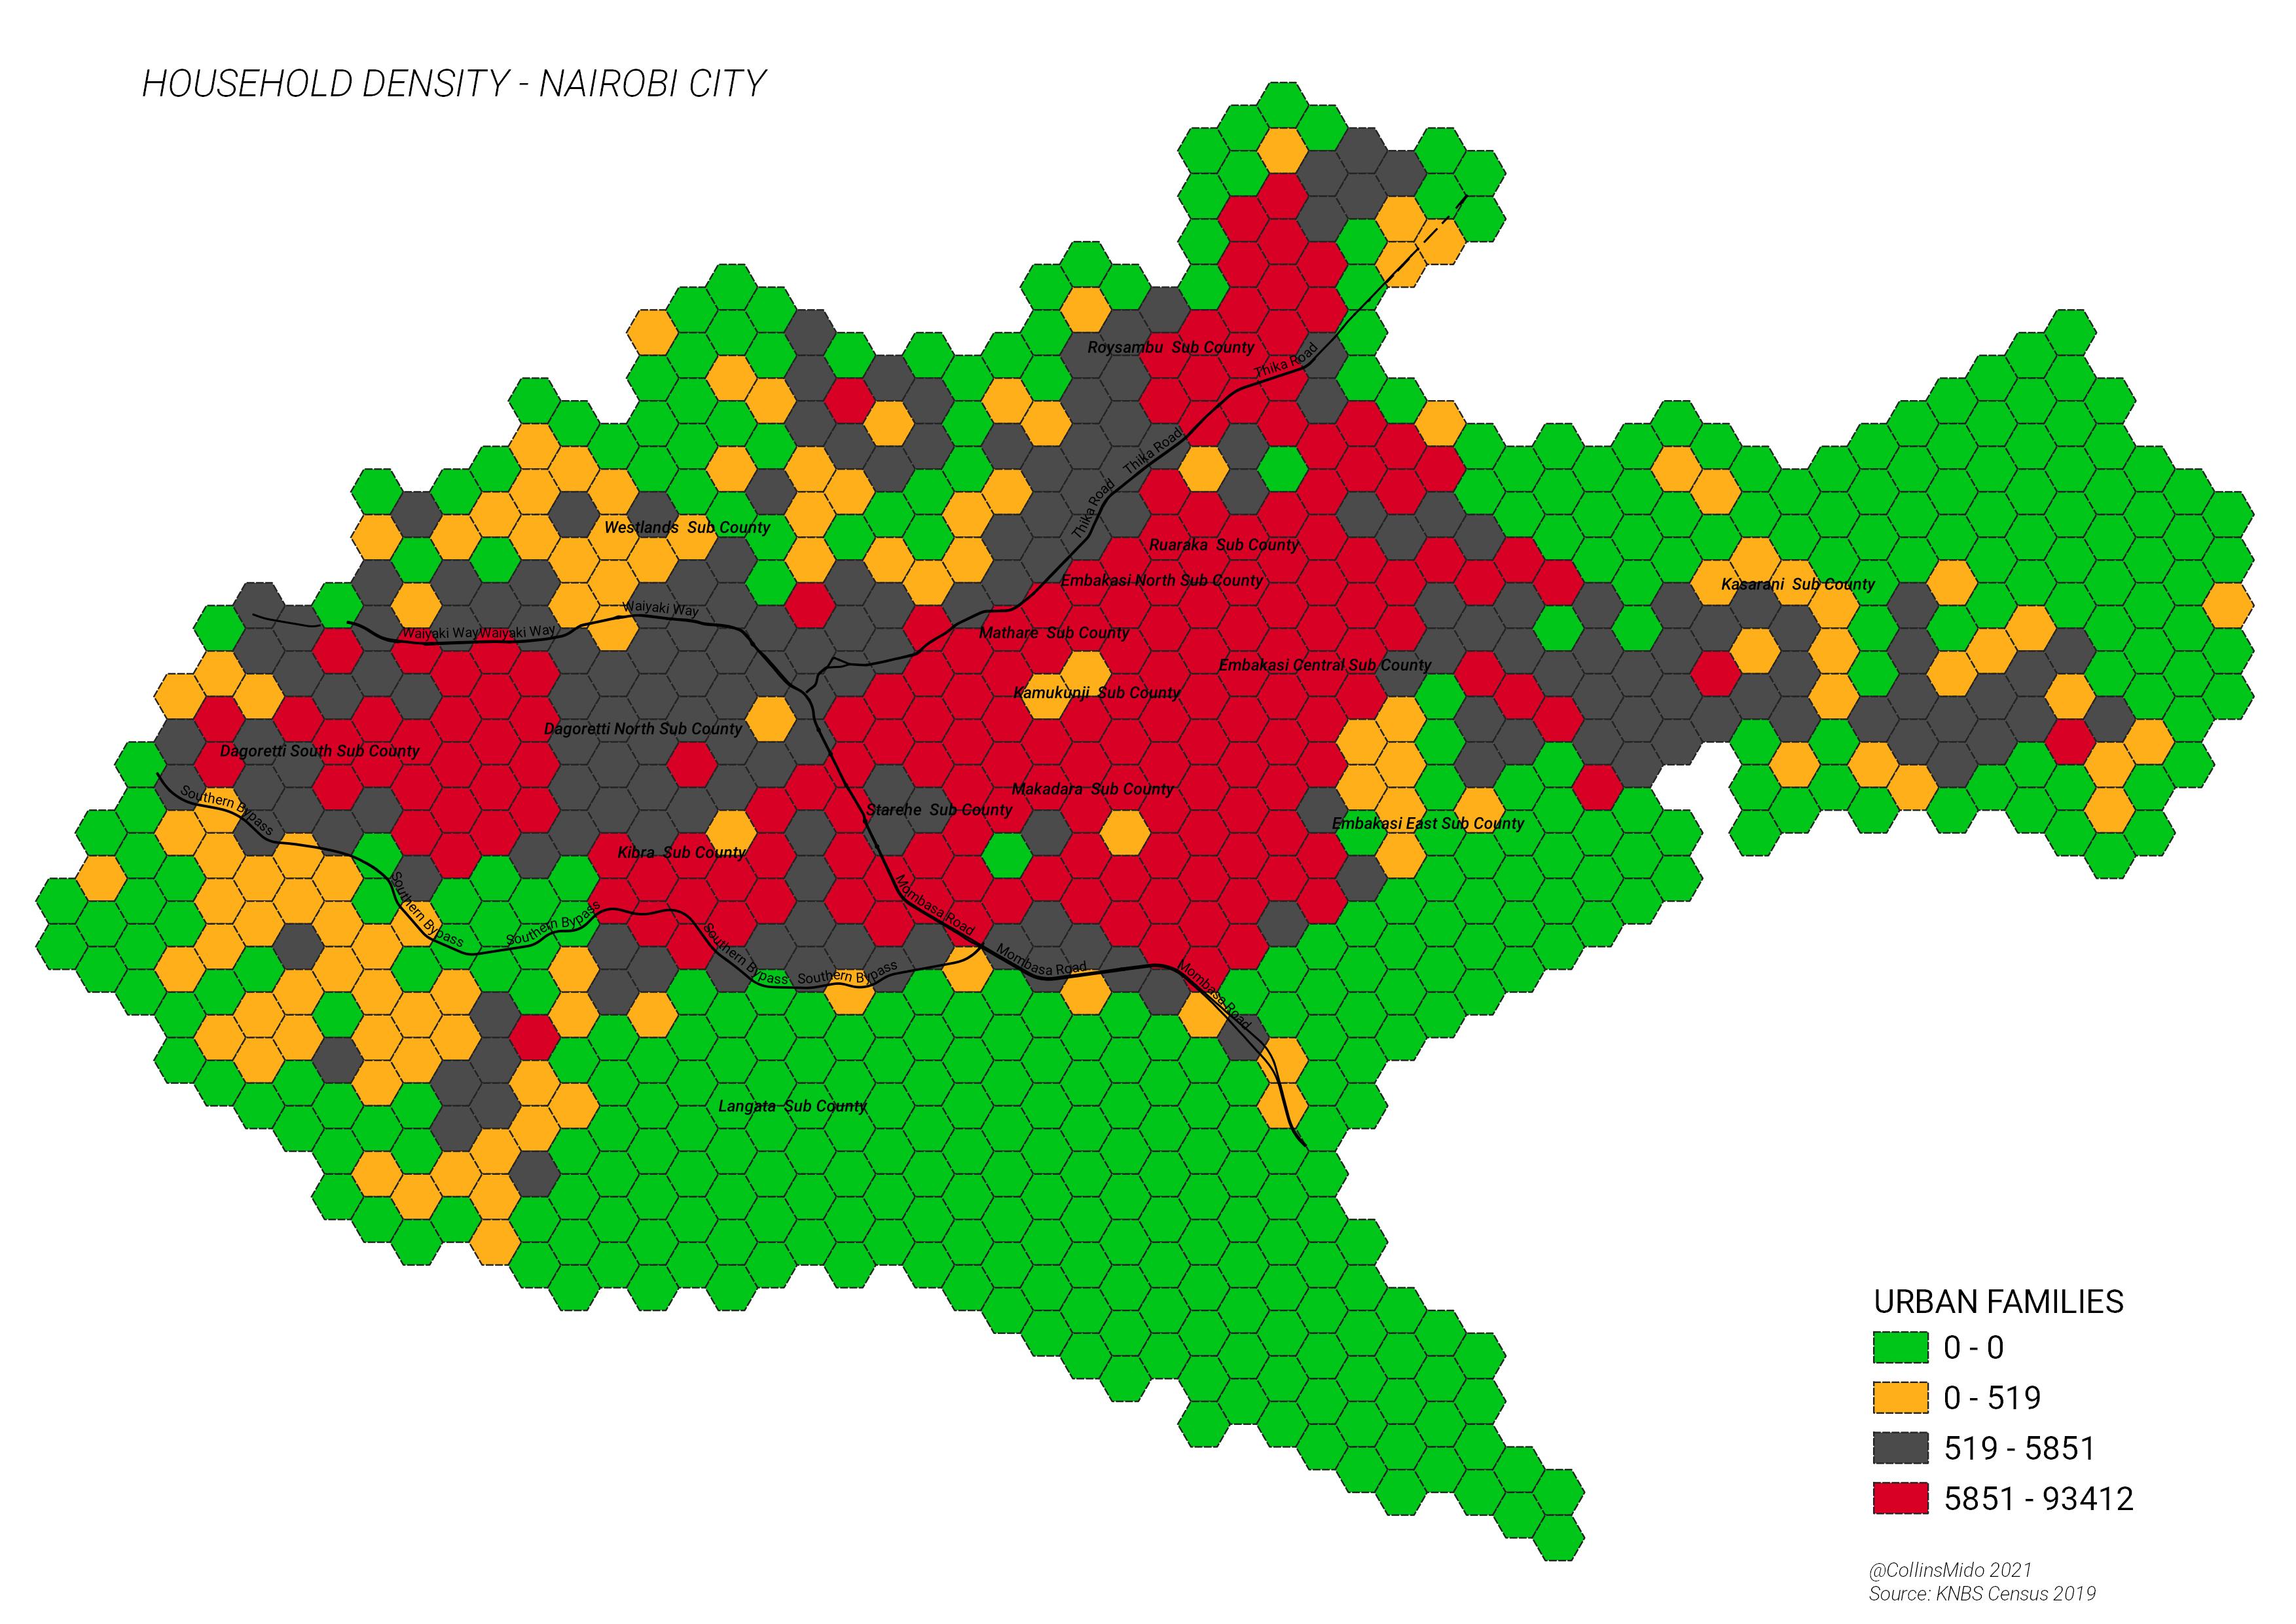
Population Density Analytics
Explore Nairobi's population distribution through interactive
visualizations. This bar chart shows sublocations by population
density (persons/km²), helping identify high-density urban areas for
planning infrastructure, housing, and services. Data sourced from
2019 census with growth projections.
💡
Key Insights
Highest Density Areas: Mathare leads with over
73,000 persons/km², followed by Mukuru Kwa Njenga and Kayole
Central.
Growth Projections: Nairobi's population is
projected to reach 5.26M by 2030, a 12% increase from 2022.
Planning Tools: Overlay this data with zoning
layers on the map for better decision-making.
Data Source: KNBS 2019 Census – Household size,
area, and density metrics.
🏥
Healthcare Facilities Distribution
Analyze the distribution of healthcare facilities across Nairobi's
sub-counties with this interactive chart. Understand the
availability of hospitals, health centres, dispensaries, and bed
capacities to inform healthcare planning and resource allocation.
Data sourced from Nairobi County Health Department records as of
2024.
173Total Hospitals
8,547Total Hospital Beds
312ICU Beds
42Avg Facilities/Sub-County
Hospitals
Health Centres
Dispensaries
Nursing Homes
Clinics
💧
Water Distribution Analytics
Advanced visualizations based on the Nairobi City Water and Sewerage
Company
Equitable Water Distribution Programme (June 2025).
The programme shows a rotational supply system in which most areas
receive water 2 to 3 days per week, while critical institutions and
a limited set of priority zones remain on 24/7 supply. The same
source highlights strong geographic disparities, weekend service
drops in vulnerable areas, and heavy dependence on major bulk water
sources and aging network infrastructure.
2-3 daysTypical rotational supply for many zones
84%Share supplied by Ndakaini Dam
4,500 kmApproximate water pipe network length
40%Estimated non-revenue water loss
2,200 kmApproximate sewer network length
~40%Formal sewer coverage across Nairobi
Programme Notes
24/7 priority supply: Continuous service is
concentrated around critical institutions such as Kenyatta
Hospital, University of Nairobi, DOD facilities, Upperhill, and
selected high-demand western corridors.
Intermittent and low-pressure zones: Informal
settlements and outer residential areas, including Kibera,
Kawangware, and parts of Dagoretti and Kasarani, experience
shorter or lower-pressure service windows.
Source system: Bulk water is drawn mainly from
Ndakaini Dam, supported by Thika, Sasumua, Ruiru and more than
200 boreholes across the metro system.
Radial Supply Distribution
Regional Comparison
← Scroll horizontally →
24/7 Supply
Intermittent
Insight: Westlands has the highest 24/7 supply
at 35%, while Kasarani has the lowest at 8%. Embakasi Upper and
Lower also remain heavily intermittent at about 90% and 88%
respectively, showing how continuous supply is still confined to
a small set of protected zones.
Insight: The hierarchy shows critical 24/7
nodes in Westlands and Upperhill, with several western branches
carrying 168 hours per week. In contrast, Langata and Kasarani
branches contain more intermittent downstream areas, making them
more sensitive to balancing and pressure shortfalls.
Weekly Supply Patterns
Temporal Analysis
← Scroll horizontally →
Streamgraph showing hourly supply patterns through the week
Insight: Westlands shows consistent high supply
across the week, while Kibera drops to some of the shortest
weekend windows in the matrix. Langata and Dagoretti also show
marked weekend reductions, reinforcing the programme's uneven
temporal service pattern.
Insight: Westlands and Dagoretti share the
strongest supply correlation (20 hours shared pattern),
suggesting interconnected infrastructure. Kasarani's weak
connections point to a more isolated and fragile service
profile, with fewer strong schedule alignments to other zones.
Coverage Area Hierarchy
Proportional Analysis
24/7 Supply Zones
Intermittent Supply Zones
Insight: Westlands dominates the
high-reliability end of the programme, while Kasarani and lower
Embakasi zones sit in the weaker coverage band. This mirrors the
broader document theme of unequal continuity between core
protected corridors and peripheral or low-income service areas.
Weekend Reliability Gap
Equity Signal
Dumbbell chart comparing weekday average supply versus weekend
average supply by zone.
Insight: Zones with the largest weekend drop
are most vulnerable to inequitable service continuity. The
biggest weekend penalties fall in Kileleshwa, Kibera, and
Dagoretti, indicating where weekend balancing and pressure
stabilization would have the clearest equity effect.
Data Sources:KNBS 2019 Census •
Nairobi City Water and Sewerage Company (June 2025) •
Nairobi County Health Department (2024)
Visualizations built with D3.js and Chart.js. Data is subject to
change as new information becomes available. Please refer to source
documents for detailed methodologies and definitions. • Hover over
charts for detailed data
Downloadable High-Resolution Map Products
Professional-grade maps designed for urban planners, researchers,
developers, students, and decision-makers.
All maps are high-resolution JPEGs — perfect for
reports, presentations, printing (A3/A2), GIS overlays, and offline
reference.
📄
Ready-to-Use Formats
High-res JPEG – A4/A3 print-ready, digital sharing
🗺️
Key Planning Themes
Zoning, population, water, roads, land use & more
⚡
Instant Download
No login required – direct links, no waiting
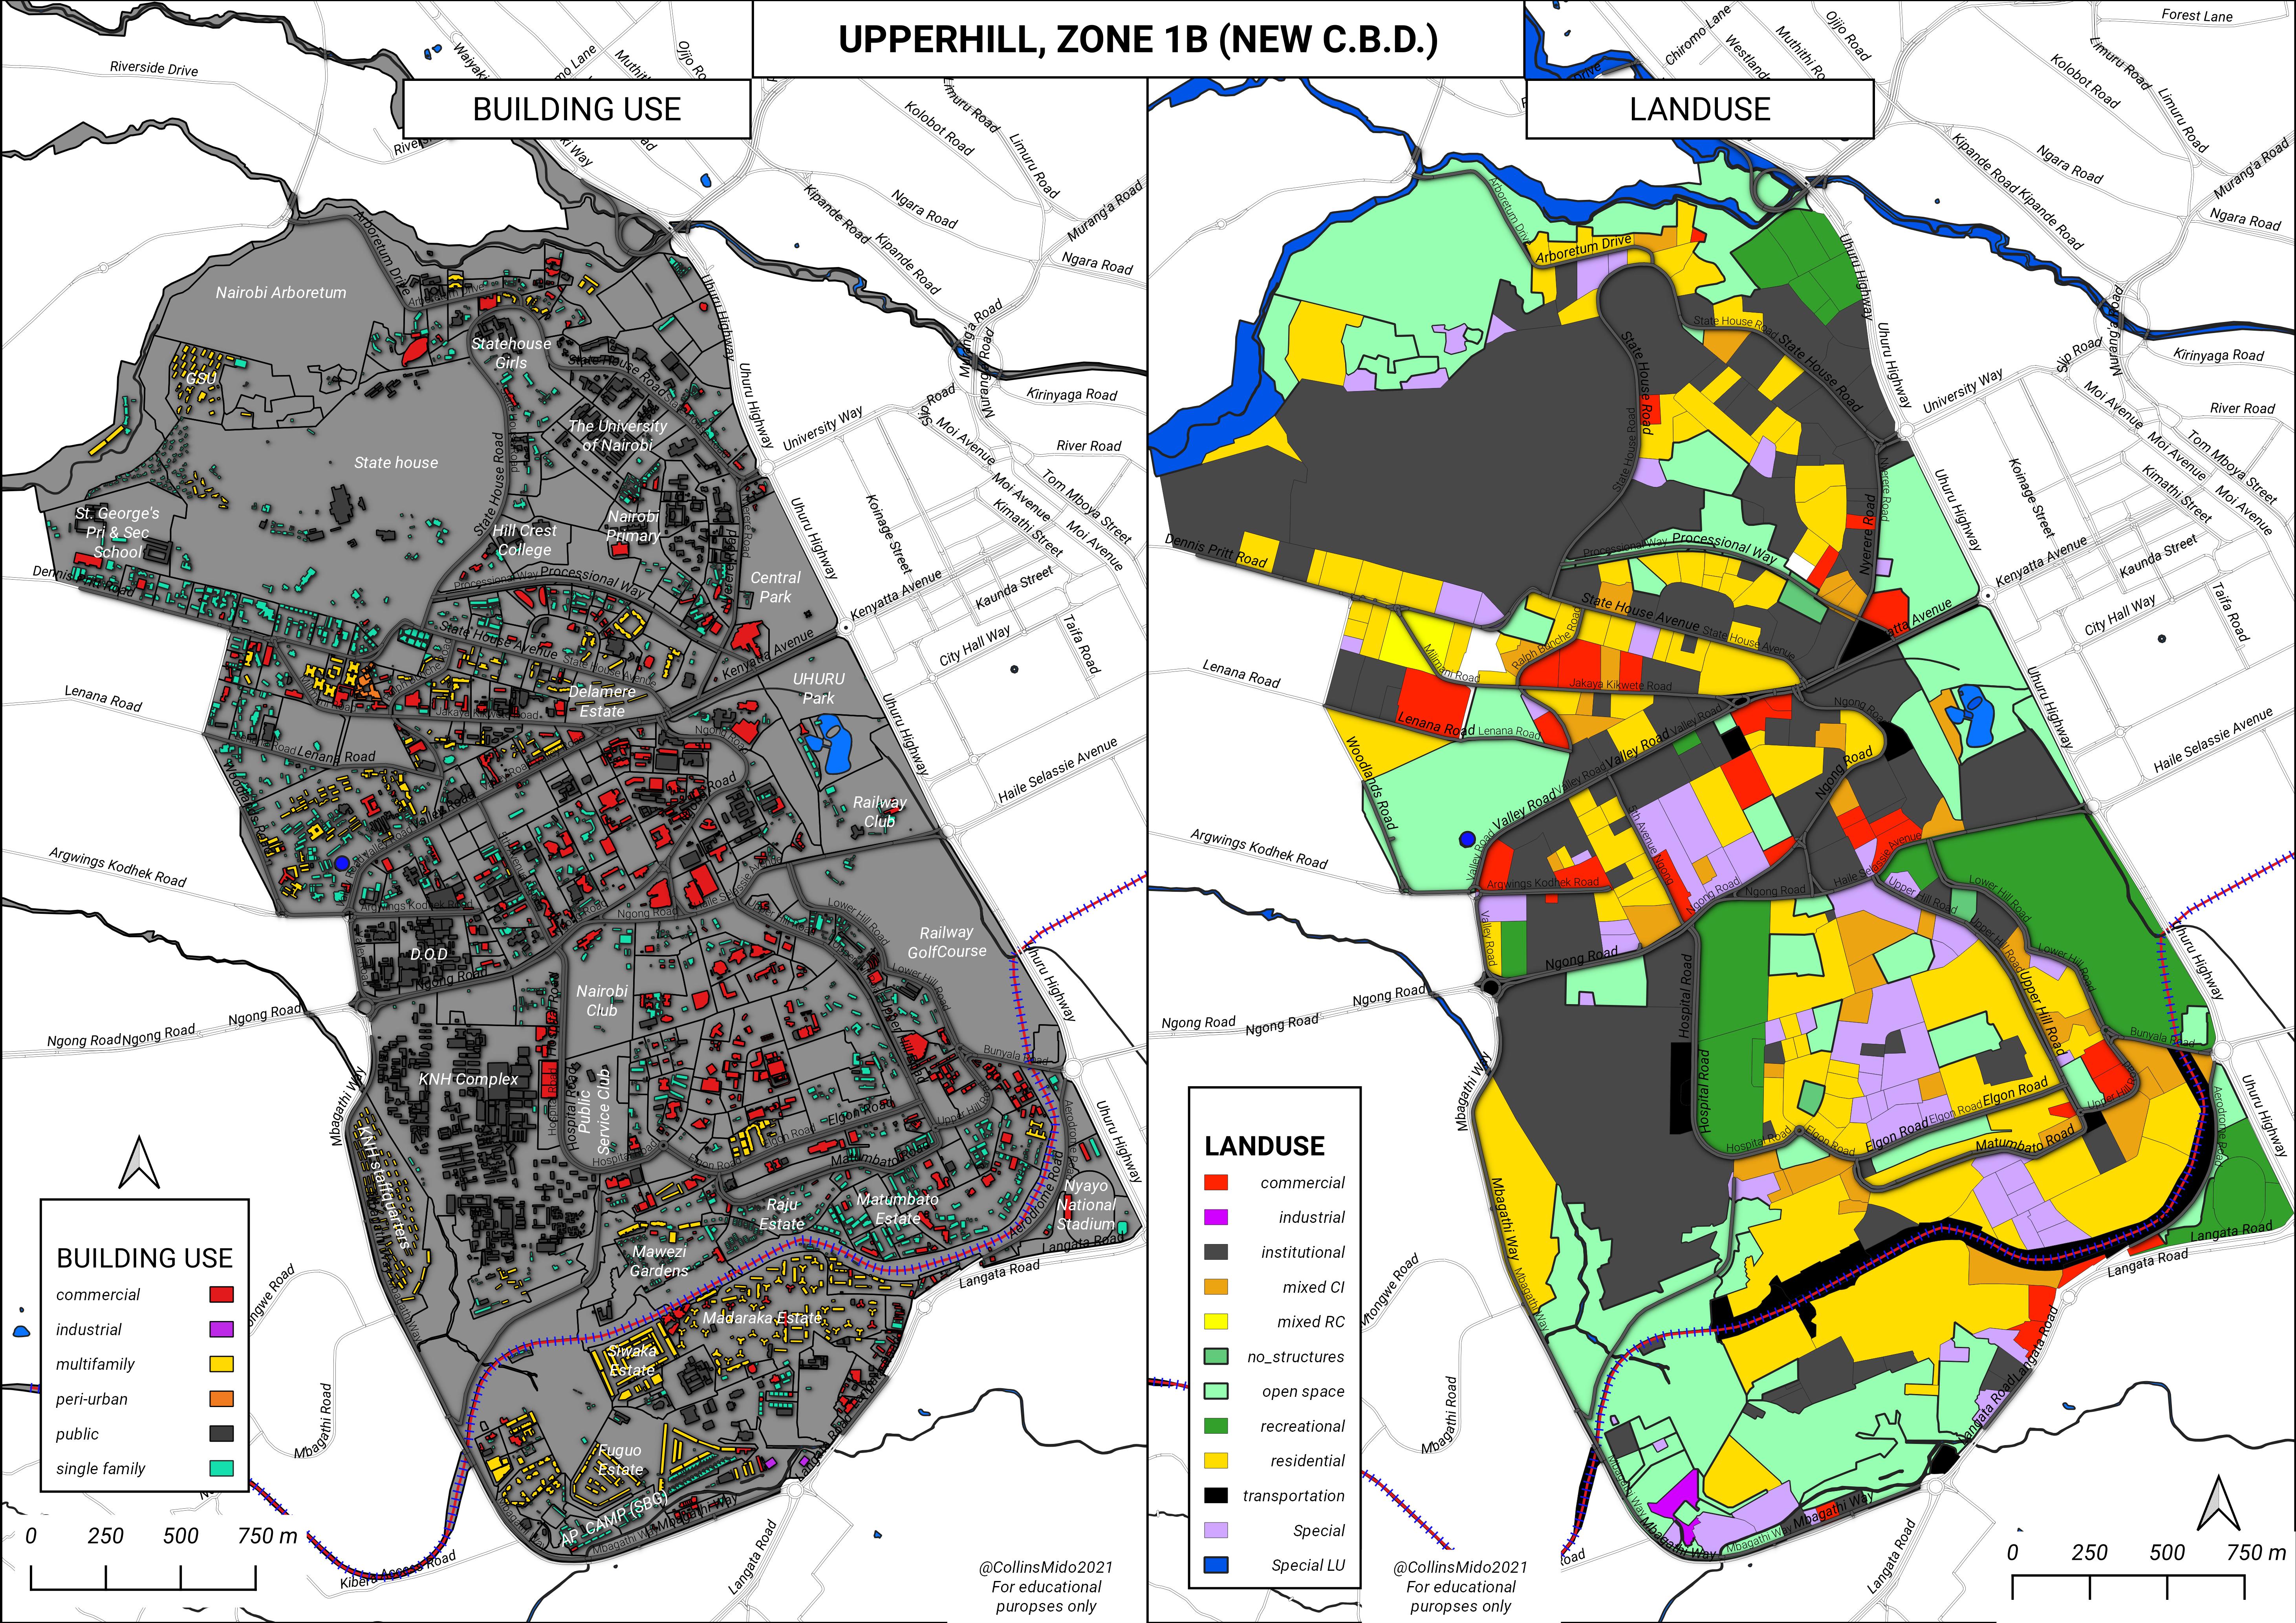
Land Use & Zoning
Comprehensive zoning map showing residential, commercial,
industrial, and green belt areas across Nairobi County.
Nairobi's rapid urban growth, informal settlements, and climate
vulnerabilities make remote sensing a powerful tool for evidence-based
planning. Satellite data helps track land use/land cover (LULC)
changes, urban heat islands (UHI), flood-prone zones, and urban
expansion patterns across the city and its peri-urban areas.
Key Applications in Nairobi
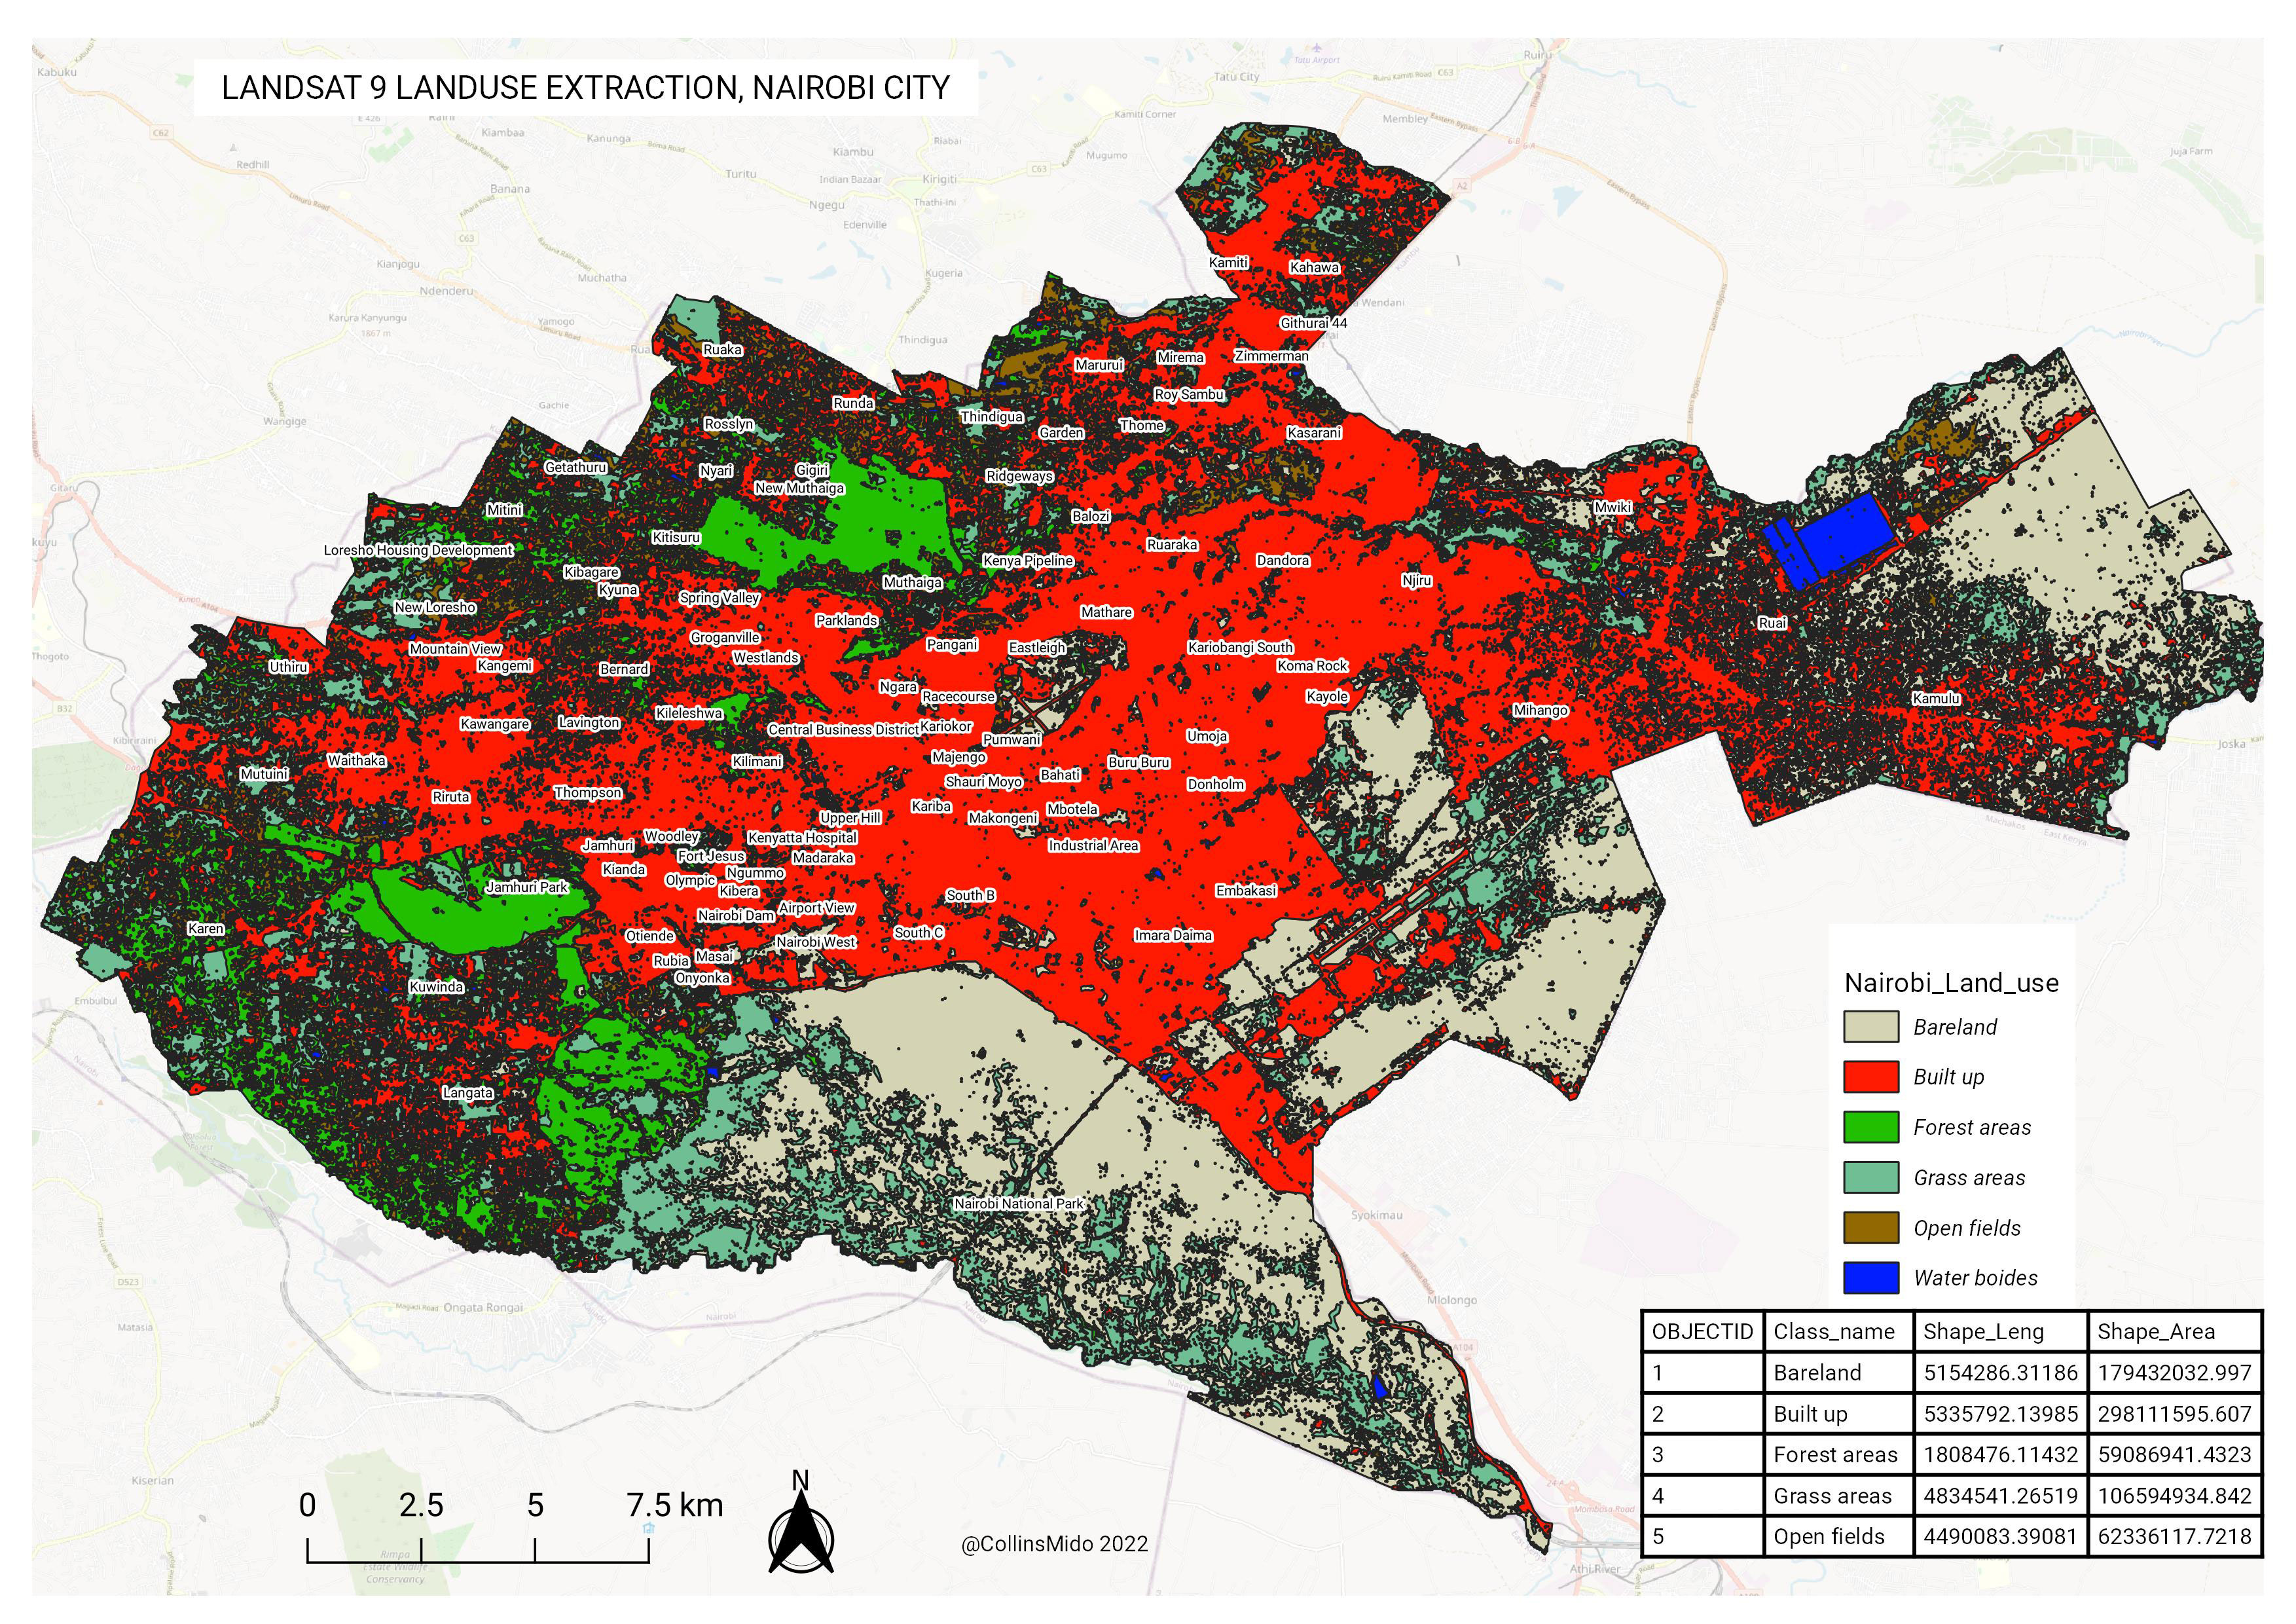
Land Use / Land Cover Change Monitoring
Multi-temporal Landsat imagery (Landsat 8 & 9) and Google Earth
Engine (GEE) workflows have revealed significant conversion of
agricultural land, forests, and open spaces into built-up areas in
Nairobi County between 2000–2023. Studies show built-up land
increasing dramatically around the city core, Dagoretti, Kasarani,
and Embakasi, while vegetation cover declines — directly affecting
ecosystem services and food security near the city.
Urban Heat Island (UHI) Analysis
Research using Landsat 8 TIRS thermal bands has mapped surface urban
heat islands in Nairobi, showing higher land surface temperatures
(LST) in densely built-up central areas (CBD, Eastlands, industrial
zones) compared to greener suburbs (Karen, parts of Westlands).
Vegetation loss (low NDVI) and impervious surfaces strongly
correlate with UHI intensity, with studies documenting increases in
UHI from 2002–2018.
Flood Mapping & Vulnerability with SAR
Synthetic Aperture Radar (SAR) sensors (e.g., Sentinel-1) enable
flood extent mapping during rainy seasons, even under cloud cover —
critical for Nairobi where pluvial and riverine flooding frequently
affects informal settlements (Mathare, Kibera, Mukuru). SAR-derived
inundation maps combined with DEMs help identify flood-prone
low-lying areas along the Nairobi River and Ngong River corridors.
Urban Expansion Modelling
Cellular automata and machine learning models (often implemented in
Google Earth Engine or ENVI) project future urban sprawl in Nairobi.
These models use historical Landsat time series to simulate
expansion toward Ruiru, Ongata Rongai, and Kitengela, helping
planners anticipate pressure on infrastructure, green spaces, and
agricultural land around the metropolitan region.
Tools & Instruments Commonly Used for Nairobi Studies
Landsat 8 & 9 (Optical + Thermal)
Primary source for LULC classification, NDVI, LST/UHI mapping, and
long-term change detection (30 m resolution, free via USGS / GEE).
Google Earth Engine (GEE)
Cloud platform used in many Nairobi studies for processing large
Landsat/Sentinel archives, random forest classification, and
time-series trend analysis.
ENVI & ERDAS Imagine
Desktop software popular for supervised/unsupervised classification,
atmospheric correction, and advanced change detection on Landsat and
high-resolution imagery.
SAR (Sentinel-1)
All-weather radar data for flood inundation mapping and urban change
detection in cloudy/rainy conditions common in Nairobi.
These techniques support Nairobi's County Integrated Development Plan,
climate adaptation strategies, and efforts to balance urban growth
with environmental protection. Explore interactive layers in the map
to visualize recent changes.
Aviation and Nairobi Urban Planning
This section profiles the four key air facilities shaping Nairobi's
growth: JKIA, Wilson Airport,
Moi Air Base, and
Eastleigh Air Base. Their operations influence
transport corridors, allowable building heights, compatible land uses,
environmental quality, and emergency response planning across the
city.
Planning Note:
Aviation facilities are strategic infrastructure. In nearby zones,
planning decisions should account for flight safety surfaces, approach
and departure corridors, noise-sensitive land uses, high-occupancy
development intensity, and disaster risk management.
Airport and Airbase Profiles
Jomo Kenyatta International Airport (JKIA)
Nairobi's primary international gateway and major economic anchor
for logistics, trade, tourism, and employment.
Strengthens airport-city development along the eastern transport
axis
Drives demand for logistics, hotels, warehousing, and business
services
Requires strict height and obstacle control around flight paths
Wilson Airport
Key domestic and regional airport supporting business travel,
medevac, tourism flights, and charter operations.
Supports high-frequency short-haul movements close to the urban
core
Increases importance of noise-compatible land uses nearby
Influences mobility planning in Langata and adjoining corridors
Moi Air Base
A strategic defense facility that shapes security zoning,
restricted development envelopes, and emergency-readiness
networks.
Imposes tighter controls on adjacent high-risk or incompatible
uses
Supports national resilience and rapid response operations
Needs coordinated buffering in county spatial plans
Eastleigh Air Base
A military aviation site in a dense urban context with direct
implications for local land management and public safety planning.
Requires careful control of nearby building heights and use
intensity
Highlights need for coordinated civil-military planning
interfaces
Shapes infrastructure and access management in surrounding
neighborhoods
How Aviation Affects Nairobi Land Use
Zoning compatibility: Noise-sensitive uses such
as schools, hospitals, and high-density housing should be
evaluated carefully near airport influence areas.
Building envelope controls: Height restrictions
and obstacle limitation surfaces must guide approvals for towers,
masts, and large rooftop structures.
Economic clustering: Aviation attracts freight,
hospitality, conferencing, and maintenance services, creating
focused growth corridors and logistics nodes.
Mobility pressure: Airport workers, passengers,
cargo trucks, and service fleets increase demand for reliable road
and public transport capacity.
Environmental management: Planners should track
aircraft noise, localized air quality impacts, and green buffers
in surrounding communities.
Safety and emergency planning: Development
control should preserve response routes, emergency staging spaces,
and inter-agency coordination zones.
Spatial Planning Priorities for the City
Airport influence area mappingNoise-compatible zoning overlaysHeight and obstruction safeguardingCargo and logistics corridor managementCivil-military planning coordinationRisk-informed urban development controls
Suggested GIS workflow: layer airport and airbase locations with
zoning, density, major roads, and public facilities to identify where
growth should be encouraged, constrained, or redesigned.